Quick and simple to use, T-Charts have become a staple in teachers’ toolboxes. Using a T-Chart, however, may be wasting valuable instructional time. If you simply want to capture information, a T-chart is a great tool and so is a piece of notebook paper. If you haven’t already figured it out, students can complete a T-Chart and have no idea what the information means.
Capturing and organizing information is not an end in itself, but rather a means to an end. The “end” is that students understand the information and are able to draw conclusions. When teachers use T-Charts solely to capture information, and do not push their students to make sense of the information, teachers forfeit an incredible learning opportunity for students.
Don’t despair. You can transform your T-Chart into a powerful instructional strategy. Incorporate these 5 essential elements to challenge student thinking, and maximize student learning.
5 Essential Elements for Effective T-Charts
A T-Chart is a graphic organizer, or structure, to capture and organize information. Draw a large T and you will see two columns–one on the left and one on the right. The columns are used to organize and record information. For T-Charts to academically “pack a punch,” they must include the following 5 elements.
1. Clarify the purpose of the T-Chart
Too often teachers identify the T-Chart’s purpose. Instead, require students to articulate the purpose of the T-Chart. Students who generate a purpose for their learning are more engaged in the task.
Teach students to ask themselves: What am I trying to figure out? What is my goal?
Here are some examples:
I want to know how the American Revolution started.
I want to know why so many immigrants came to America around 1900.
I want to know if the news article is true.
I want to know if I should buy an iPhone.
My goal is to understand the process of photosynthesis.
My goal is to understand what you mean when you say ‘I don’t listen’.
2. Select the best way to organize the information
Once students know the purpose of the T-Chart, they should select the most effective way to organize the information. The purpose may require students to organize by similarities/differences, problems/solutions, then/now, cause/effect, fact/opinion, etc.
Following the examples listed above, an effective way to organize the information might look like:
Identify causes and effects of the American Revolution.
Explore the advantages and disadvantages of immigration in 1900.
Separate facts and opinions in a news article.
Identify the pros and cons of owning an iPhone.
Use questions and answers to understand photosynthesis.
Clarify what listening looks like and doesn’t look like.
Selecting the most effective way for organizing information is a skill students learn.
3. Gather information
Once students clarify the purpose and select how to organize the information, students record the purpose as a topic and add the organizational headings to the T-Chart.
Example: Explore advantages and disadvantages of immigration in 1900.
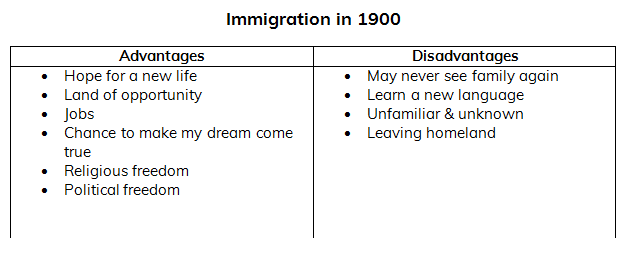
Now it’s time for students to add information to the T-Chart.
Teach students to ask themselves: What information do I have?
Students use resources to list advantages on the left and disadvantages on the right.
Once the T-Chart is complete, unfortunately, many teachers stop here. Instead, take your students further and teach them how to make sense of the information.
4. Examine the Information
The way we teach students to make sense of the information, is to ask them to examine and/or compare the two lists.
Teach students to ask themselves: What do I notice? What does this tell me? What ideas surface from the information?
Students write down their ideas in sentences.
Example:
It would be difficult to never see family again, but their children would have a future.
With jobs and opportunity, a dream would be a possibility.
Having religious and political freedom outweighs the challenge of going to an unfamiliar country.
There are more advantages than disadvantages.
5. Draw a Conclusion
After students examine the information and capture their ideas, they now have the opportunity to draw a conclusion. Students reflect on their prior knowledge and experience, and if it is relevant to the present situation, they combine it with the information in the T-Chart to form an opinion, make a judgment, or draw a conclusion.
Teach students to ask themselves: So what? What is my conclusion, opinion, decision, or judgment?
Example:
For immigrants, the advantages far outweighed the disadvantages of uprooting and immigrating to America. The advantages were much more significant and had a greater impact on their lives and their future than what they were leaving behind. Not always an easy decision, but the right decision for many if not most.
Now you know how to make a T-chart more effective, you can confidently use a T-Chart to push your students’ thinking to a higher level and your students will have a much deeper understanding of the content.
How have you used T-Charts with students? Leave a comment below.